Sketch a curve
Jump to section
Indicate a region of the graph
Remove a portion of a line or parabola
Remove a portion of a line or parabola between two points
Your instructor might ask that you sketch a curve as part of an activity.
If a question requires you to sketch a curve, the Sketch Board and Sketch Board toolbar will be available within the question.
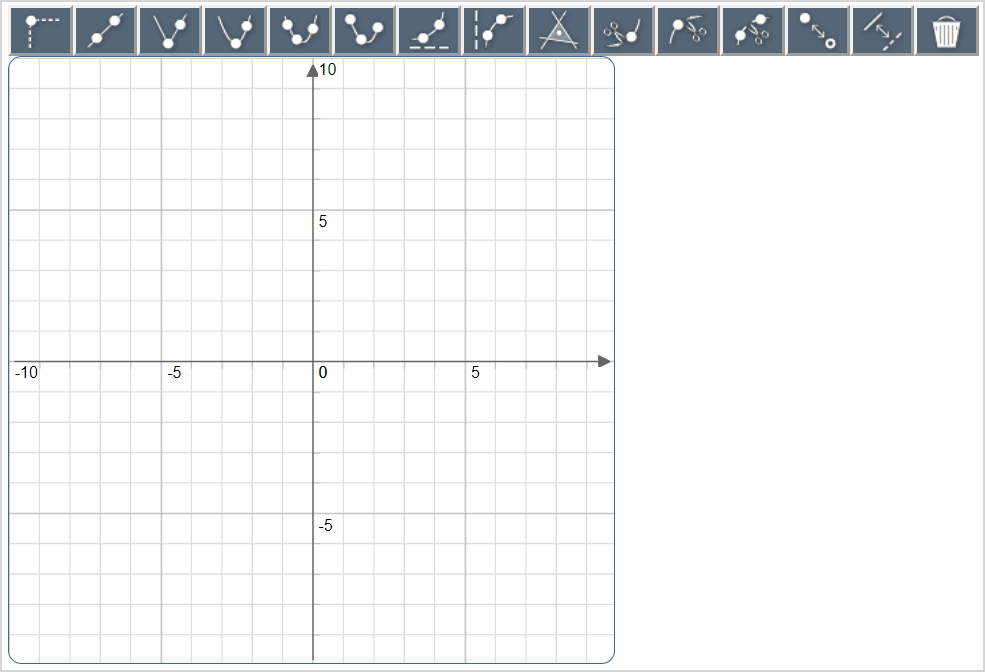
The Sketch Board is comprised of a set of tools that can be used to create and interact with various types of curve sketches.
Some example curve sketching questions are:
- Graph a single or multiple lines or curves.
- Indicate which region represents the solution set (single line or curve, multiple lines or curves).
- Make the line solid or dashed to indicate whether the line is in the solution set.
- Remove the portion of the line or curve that does not belong.
- Use an open or closed circle to indicate whether the endpoints belong.
- Add asymptotes to logarithmic and exponential curves.
Curve sketching tasks
There are 15 possible tools that can be found in your Sketch Board toolbar for you to use to sketch a curve.
Your instructor can choose which set of tools appear in the Sketch Board toolbar.

NOTE: Your instructor might choose to include more drawing tools in the toolbar than you need that act as distractors. This can be done to test if you'll make the correct selection(s).
To use a tool from the toolbar, click on it so that it becomes highlighted.

TIP: Click a highlighted tool on the toolbar to deselect it or click on a different tool.
NOTE: Your instructor can define whether you're permitted to use a tool multiple times on your Sketch Board. Example — Your instructor could define a rule in Möbius that, when using the Plot Dropline Point tool , you're only allowed to plot one point on your Sketch Board. This means that you can only plot a single point with the Plot Dropline Point tool
 but won't be able to select the tool again to plot a second point.
TIP: Hover your cursor over a plotted point to reveal its exact coordinates as an ordered pair (x-coordinate, y-coordinate).
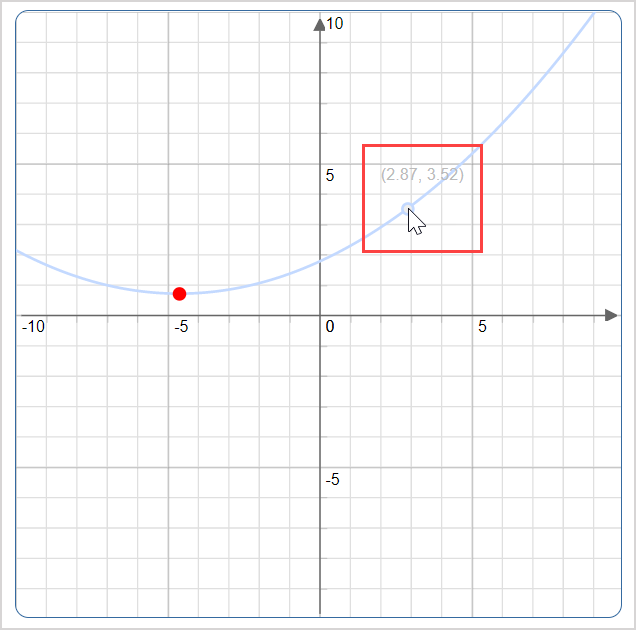
Plot a single point
You can plot individual points on the Sketch Board's coordinate grid.
To plot a single point:
Click Plot Dropline Point
 .
.
Click on the Sketch Board coordinate grid where you want your single point plotted.
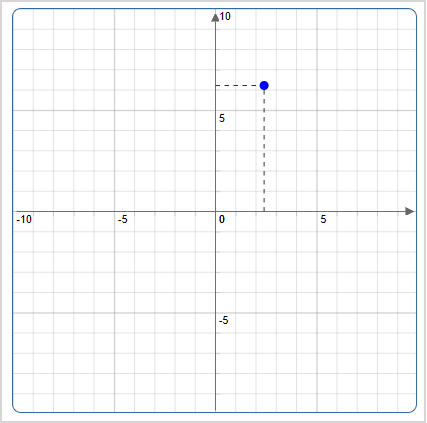
TIP: Click-and-drag the plotted point to a new location if you want to move it.
Graph a line
Graphing a line enables you to plot points on the Sketch Board's coordinate grid.
To graph a line:
Click Draw Line
 .
.
Plot two points on the coordinate grid. After you plot two points on the grid, a line is drawn through these points.
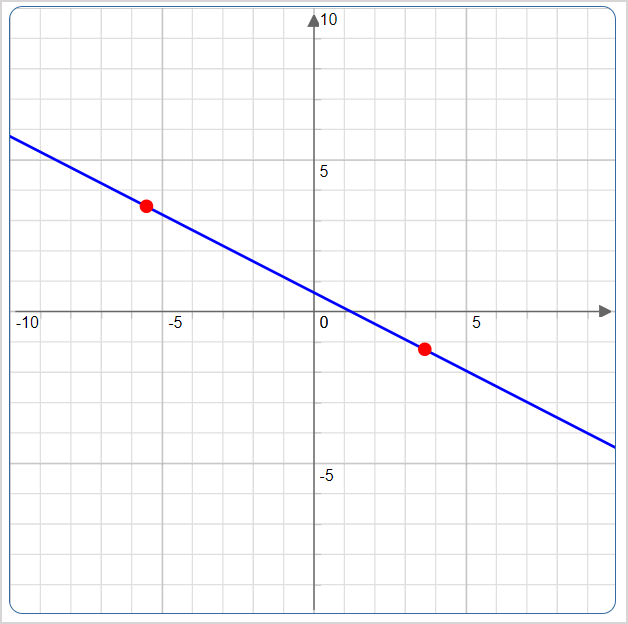
TIP: Click-and-drag the plotted points or the line to a new location if you want to move them.
Graph absolute values
You can plot the vertex and an additional point on the coordinate grid.
To graph an absolute value:
Click Draw Absolute Value
 .
.
First plot the vertex.
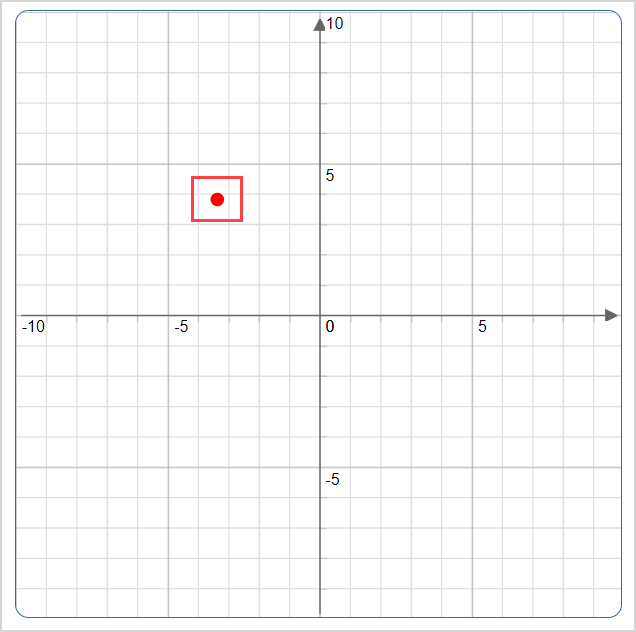
Plot the second point next. The absolute value graph is drawn automatically.
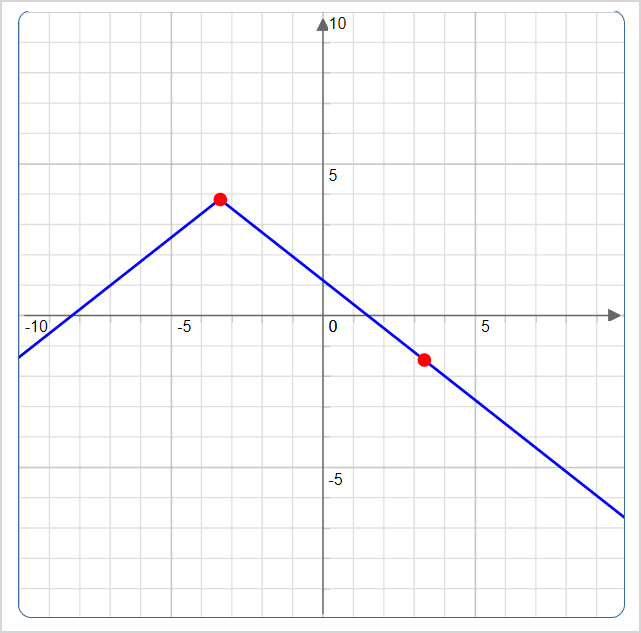
TIP: Click-and-drag either of the two points anywhere on the grid to stretch, compress, reflect, or translate the absolute value.
Graph a parabola
Graphing a parabola enables you to plot points on the Sketch Board's coordinate grid that you can reshape and reposition.
To graph a parabola:
Click Draw Vertex-Point Parabola
 .
.
First plot the vertex on the coordinate grid.
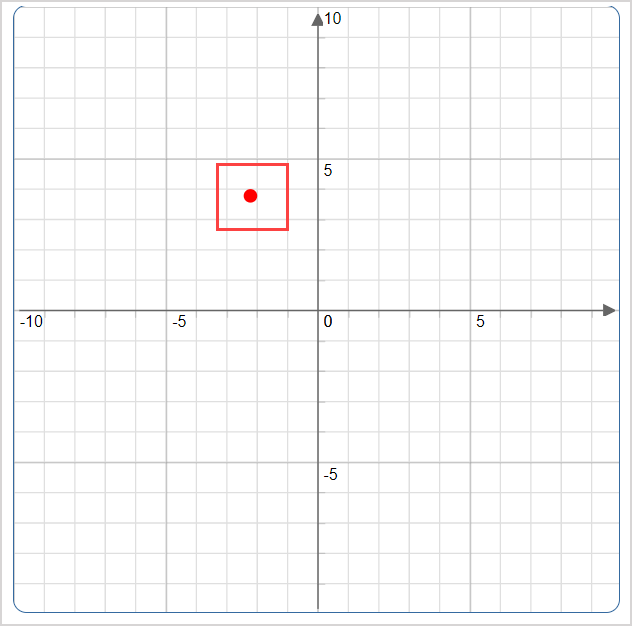
Graph your second point. After you plot two points on the grid, a curve is drawn through these points.
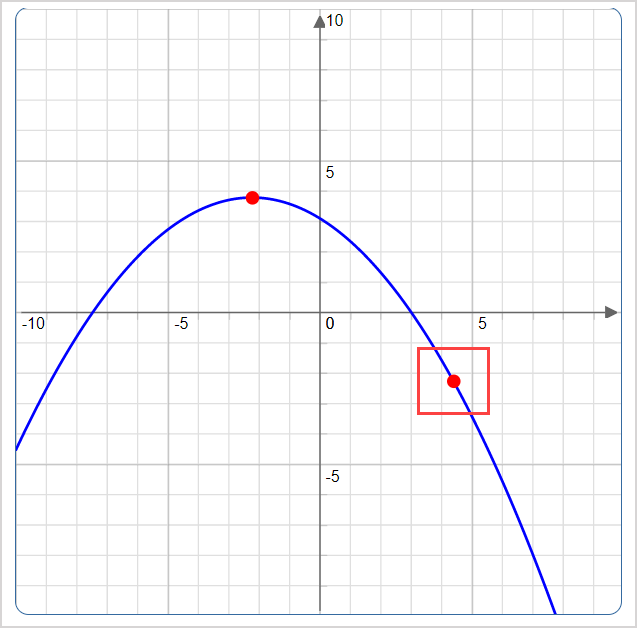
TIP: Click-and-drag either of the points anywhere on the grid to stretch, compress, reflect, or translate the parabola.
TIP: You can also click Draw Three-Point Parabola or Draw Three-Point Parabola Segment
 . The order in which these points are placed isn't relevant since the Sketch Board will automatically draw the curve with the vertex at the middle point.
Graph exponential curves
You can plot two points and a horizontal asymptote to create an exponential curve.
To graph an exponential curve:
Click Draw Exponential
 .
.
Plot two points on the exponential curve.
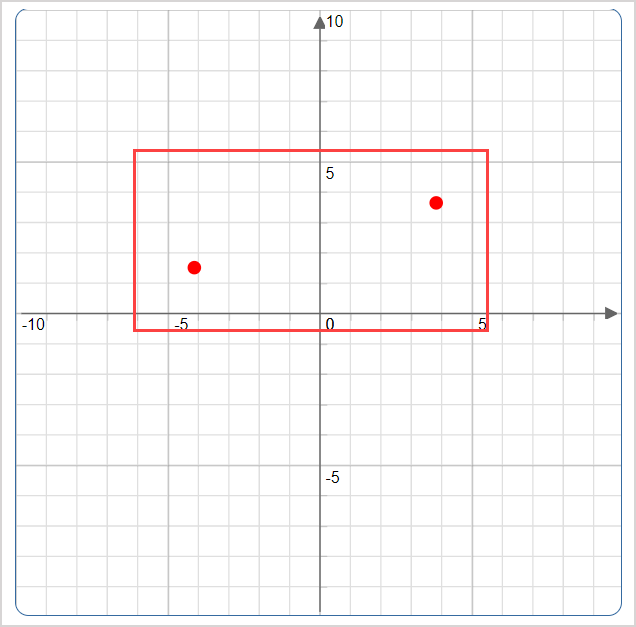
Click the location on the coordinate grid where you want to place the horizontal asymptote for the curve. A dashed horizontal line is automatically drawn through the point on the grid where you clicked.
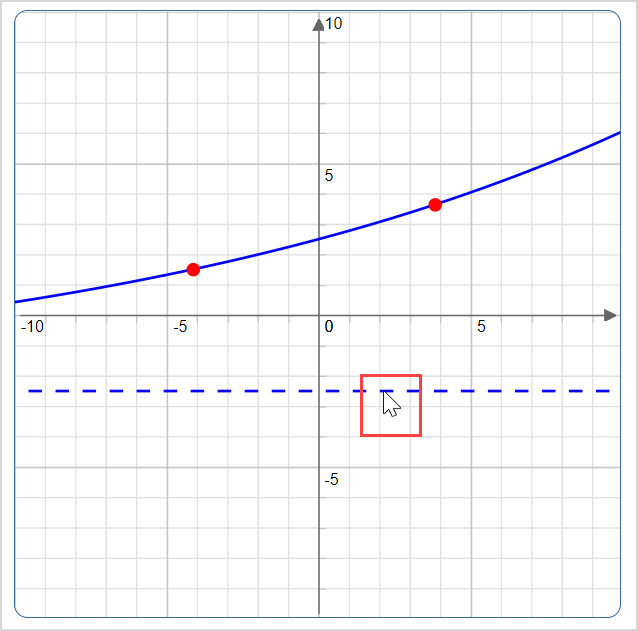
TIP: Click-and-drag the horizontal asymptote to a new location if you want to move it.
Graph logarithmic curves
You can plot two points and a vertical asymptote to create a logarithmic curve.
To graph a logarithmic curve:
Click Draw Logarithmic
 .
.
Plot two points on the logarithmic curve.
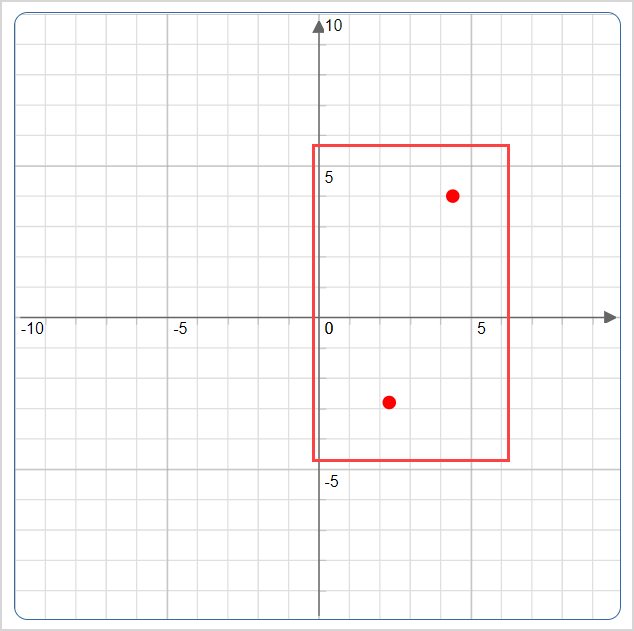
Click the location on the coordinate grid where you want to place the vertical asymptote. A dashed vertical line is automatically drawn through the point on the grid where you clicked.
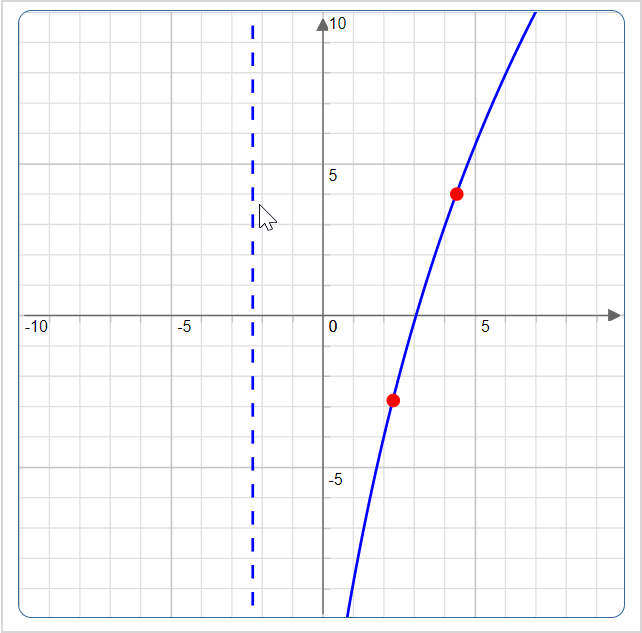
TIP: Click-and-drag the vertical asymptote to a new location if you want to move it.
Indicate a region of the graph
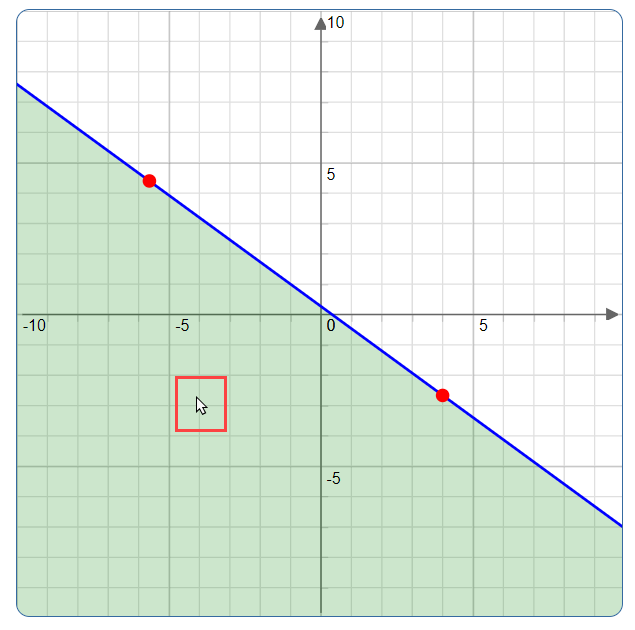
Indicating which region on the graph represents the solution set enables you to select a region on either side of a single line or select a region bounded by two lines.
To indicate a region of the graph:
Click Choose Region
 .
.
Click anywhere inside the region that represents the solution set to the problem. The region becomes shaded.
Remove a portion of a line or parabola
You can remove a portion to the left or right of a parabola.
To remove a portion of a line or parabola:
Click Snip Left
 or Snip Right
 .
.
Click on the portion of the parabola you want to keep. The portion to the left or right of your cursor (depending on the selected control) is removed.
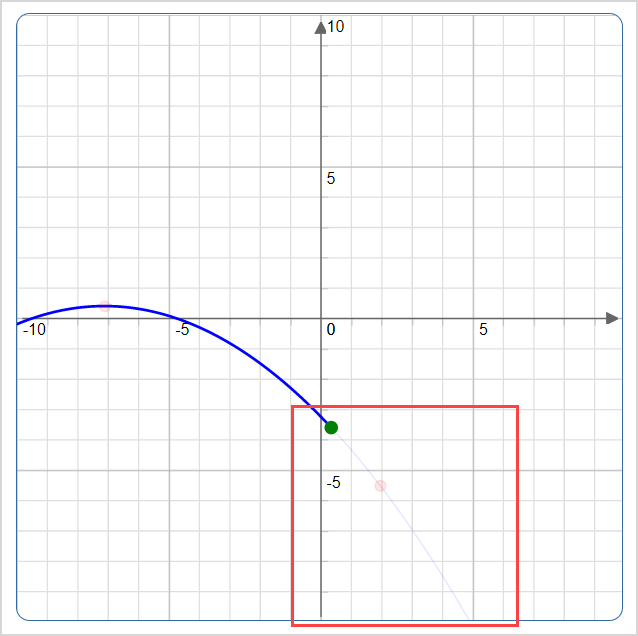
NOTE: If you selected Snip Left  , the portion of the parabola to the left of your cursor is removed. Similarly, if you selected Snip Right
  , the portion of the parabola to the right of your cursor is removed.
Remove a portion of a line or parabola between two points
You can remove a portion of a parabola between two selected points.
To remove a portion of a line or parabola:
Click Snip Between
 .
.
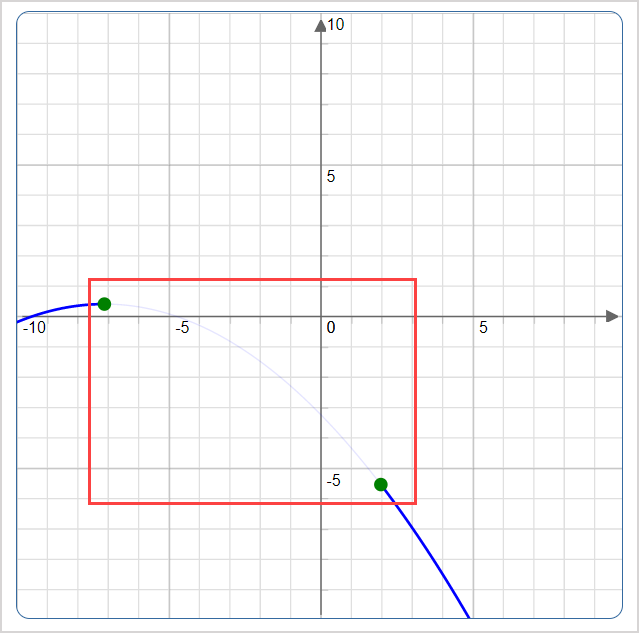
Select two points on the parabola by clicking on them. A green point indicates each selected location. The portion of the parabola between these two green points is automatically removed.
Include or exclude endpoints
You can toggle back and forth between filled (included) and open (excluded) endpoints.
To indicate the position of endpoints on the graph:
Click Toggle Filled/Hollow
 .
.
Click on the endpoint that you want to include (fill) or exclude (open).
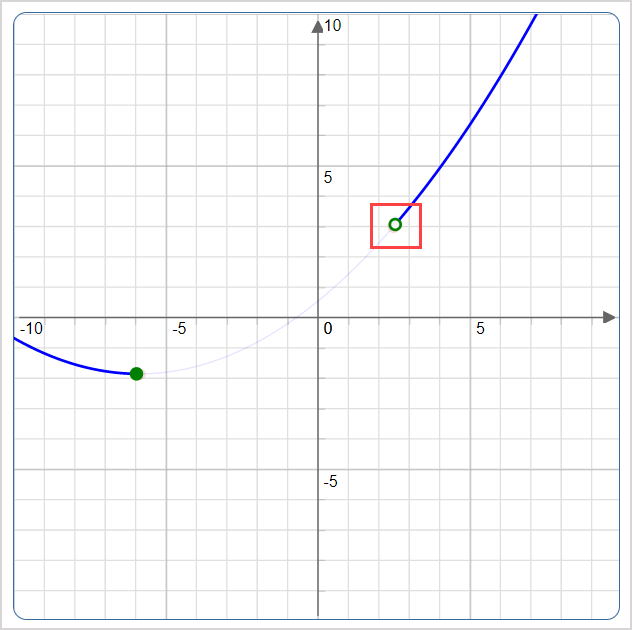
TIP: If the endpoint is filled (included), click on it to make it open (excluded). Similarly, if the endpoint is open (excluded), click on it to make it filled (included).
Make solid or dashed lines for a graph
You're able to switch between solid and dashed lines interchangeably.
To use solid or dashed lines for a graph:
Click Toggle Solid/Dashed
 .
.
Click on a line. If the line was solid, then the entire line becomes dashed.
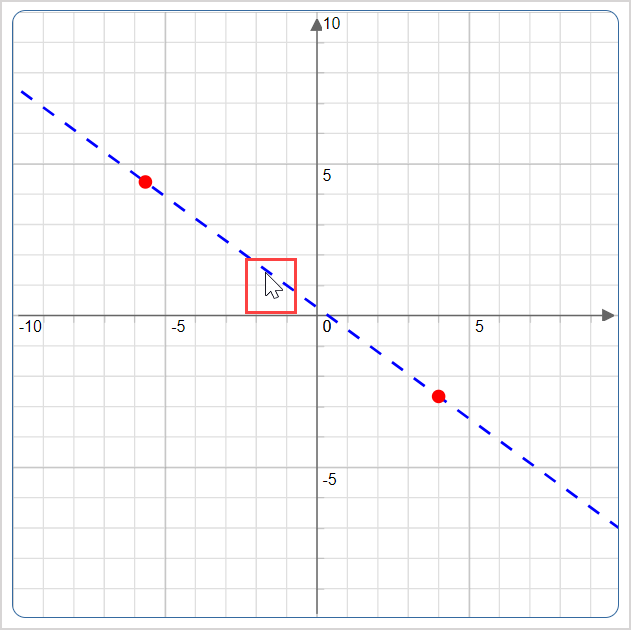
TIP: To change the line back to solid, click the line again and it will revert back to its original state.
Delete a line
Any line that you have sketched can be deleted.
To delete a line:
Click Delete
 .
.
Hover your cursor over the item you want to delete. The item becomes highlighted.

Click the highlighted item and it will be deleted from your Sketch Board.