View item statistics
Item statistics in the Gradebook are data on how your students performed on all pieces of content within a specific activity.
This information can help you to perfect the design of your content and to understand where in your content your students are excelling or struggling.
TIP: Check out Access and use the Möbius Analytics dashboards for additional insights into how your students are consuming your content.
After performing a Gradebook search (check out Search for class grades), you can view this statistical data while viewing activity Gradebook data (check out View activity Gradebook data).

NOTE: In order for item statistics to be calculated, the content must be accessible to a student by being contained within a visible activity.
TIP: You can view item statistics for individual pieces of content across all activities that the content is used in through the Content Summary pane of the Content Repository. Check out View the Content Summary pane.
IMPORTANT: Item statistics—when viewed using the Gradebook—can differ from the statistics calculated in the Content Summary pane within the Content Repository. This is because the Gradebook captures all attempts at the piece of content within a specific activity, whereas the Content Repository captures all attempts at the piece of content across all activities that it's contained in (the latter may not differentiate between student levels of mastery). Example — If a question about a newly-learned concept is first attempted on an introductory assignment, the students viewing this question may find it more difficult and perform less optimally than when it is presented on a subsequent review assignment. Therefore, the statistics displayed in the Content Repository's Content Summary pane will be less specific to the student level of mastery completing the activity than when they are viewed using the Gradebook's Item Statistics page.
View item statistics
To view the item statistics for all of the content in a specific activity:
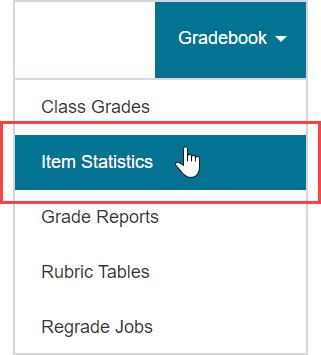
Click Gradebook on the Class Homepage.

Click Item Statistics.
Select the unit where the activity of interest is stored from the Units list.
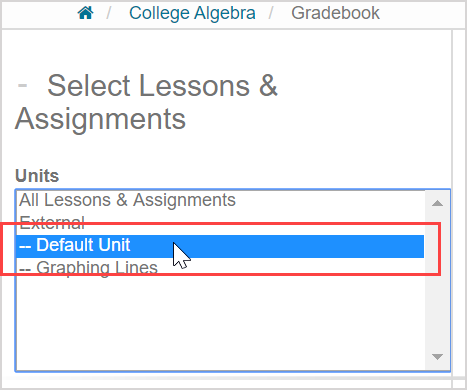
TIP: Select All Lessons & Assignments to display all of your class's activities in the list of available activities.

TIP: You can select more than one unit by pressing Ctrl (![]() ) and clicking on the units you want to include in your search.
) and clicking on the units you want to include in your search.
Select the specific activity of interest from the list of available activities.

TIP: You can select more than one activity by pressing Ctrl (![]() ) and clicking on the activities you want to include in your search.
) and clicking on the activities you want to include in your search.
Select which class you want to use to view the item statistics from the Classes list in the Filter Results pane

TIP: The parent class and all associated child classes will appear in the Classes list. You can select more than one class for viewing item statistics. Press Ctrl (![]() ) and continue to select other classes to select more than one class or child class.
) and continue to select other classes to select more than one class or child class.

Alternatively, you can:
- Click All to select all of the classes in the Classes list.

- Click Default to only select the parent class in the Classes list.

- Click Clear Selection to deselect all classes in the Classes list.

(Optional) Customize the data fields beyond the default settings that control what information is included in the calculations of your item statistics. Check out Use additional Gradebook search criteria.

Click Search.

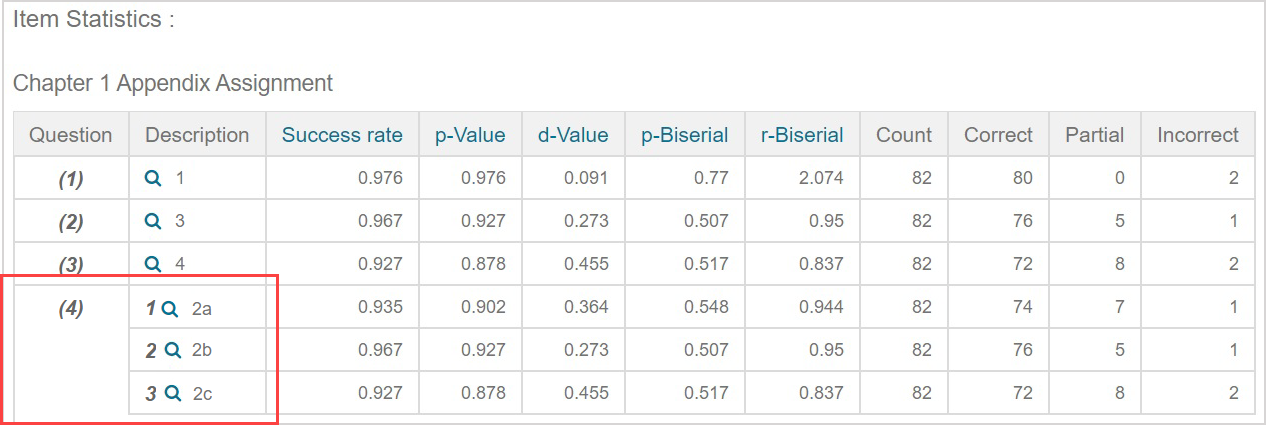
The item statistics are displayed as a part of the activity's/activities' Gradebook data (check out View activity Gradebook data for more details on other information that's displayed on this page).

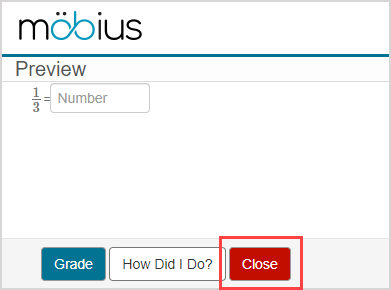
TIP: Click on the preview icon to be reminded of the question content.

Click Close in the question preview to return to the item statistics.
NOTE: If you edited the activity after students have started their attempts, this can affect the accuracy of the item statistics results and you should interpret the results with caution. This interference is indicated with the caution icon![]() .
.
![]()
NOTE: If your activity includes a question group, questions within the question group are displayed under a single question number (Example — (4)). Each question within the question group is then numbered (Example — 1, 2, and 3 within the question group identified as question (4)).
Item statistic calculations
The numerical values of the item statistics are calculated using these formulas:
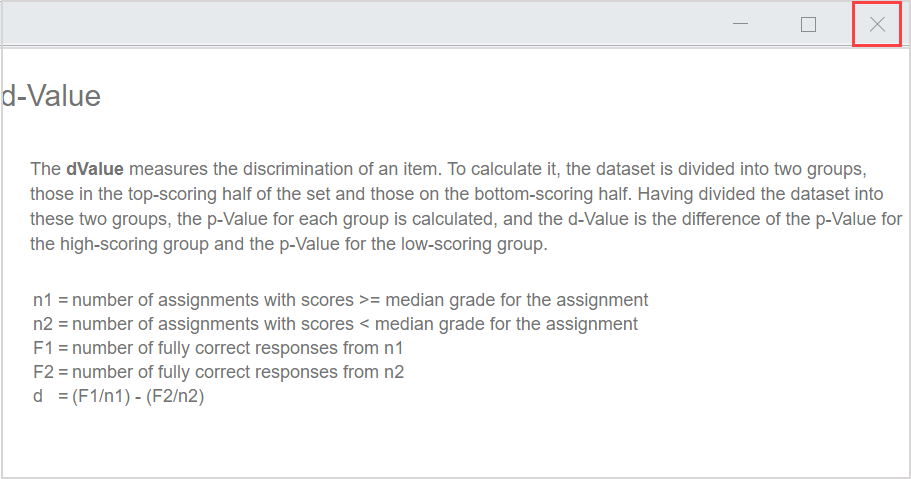
TIP: Click each statistic heading in the results table for a pop-up that explains how the value was calculated.

Close the explanatory pop-up window to return to the item statistics.
| Statistic | Explanation |
|---|---|
| Success Rate | The average normalized score on the question (i.e. grade scaled to between 0.0 and 1.0). Purpose: Measures the difficulty level of the question being asked; easier questions have values closer to 1.0. |
| p-Value | The ratio of the number of fully correct responses (i.e. where the normalized score is 1.0) to the total number of responses.
Purpose: Measures how likely students should be to fully understand the question and get it fully correct; easier questions have values closer to 1.0. |
| d-Value (discrimination value) | The difference in p-Value between two groups: those attempts that scored above the median on the full activity, and those that scored below the median.
Purpose: Measures how clearly the question discriminates between students who score higher on the full activity and those who score lower; questions that are better discriminators have values closer to 1.0. |
| p-Biserial (point-biserial correlation coefficient) | A correlation coefficient relating performance on a question with dichotomized grades, to performance on the full activity. Measures the extent to which students who score high on the activity tend to get the question correct and those who score low tend to get the question incorrect.
Purpose: Best used when the question doesn't permit partial grading (i.e. grades are 1.0 or 0.0), this statistic indicates the level of correlation between a student answering the question correctly and them doing well on the activity. A value closer to 1 implies stronger correlation. |
| r-Biserial (biserial correlation coefficient) | A correlation coefficient relating performance on a question with normalized grades, to performance on the full activity. Measures the extent to which students who score high on the activity tend to get the question correct and those who score low tend to get the question incorrect.
Purpose: Best used when the question uses partial grading (i.e. question grades are closer to a normal distribution and less likely to be 0.0 or 1,0), this statistic indicates the level of correlation between a student doing well on the question and them doing well on the activity. A value closer to 1 implies stronger correlation. |
| Count | The number of attempts at this question included in the statistic calculations. |
| Correct | The number of attempts at this question that received a score of 1.0/1.0. |
| Partial | The number of attempts at this question that received a partial score (i.e. strictly between 0.0 and 1.0) for this question. |
| Incorrect | The number of attempts at this question that received a score of 0.0/1.0. |


 = standard deviation for activity grades.
 = standard deviation for activity grades.