Use the Sketch Board toolbar
You'll use the Sketch Board toolbar to define the correct answer to your sketch question while working in the Question Editor.
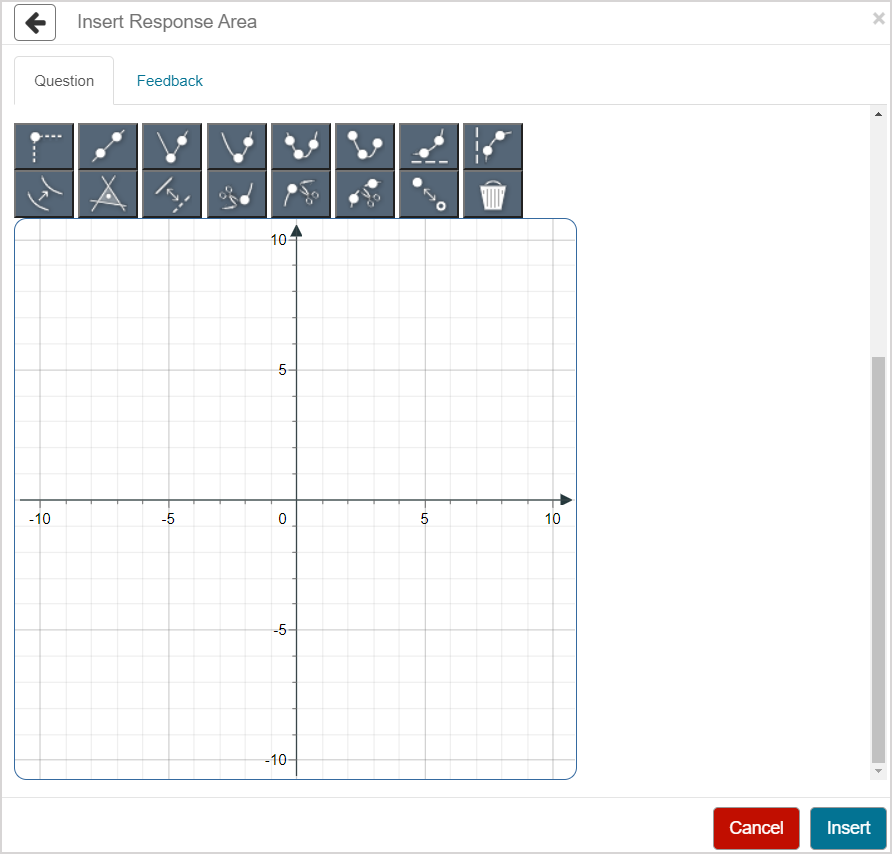
The Sketch Board tools that you use to plot the curve of the correct answer will be visible to the student on their Sketch Board toolbar when they attempt your sketch question.
TIP: You can customize the Sketch Board toolbar that your students see during their attempt at your sketch question. Check out Customize the student Sketch Board toolbar.
TIP: Check out Author a sketch question for full sketch question authoring details.
NOTE: The Sketch Board toolbar is used by both instructors during authoring and students while attempting sketch questions. Are you a student? Check out Sketch a curve for Sketch Board toolbar instructions that are specific to you!
General tips
Here are some general tips for using the Sketch Board toolbar while authoring your sketch question:
- To use a tool from the toolbar, click on it so that it becomes highlighted.

- To stop using a tool from the toolbar, click on the highlighted tool again or click on a different tool.

- Hover your cursor over a plotted point to reveal its exact coordinates as an ordered pair (x-coordinate, y-coordinate).
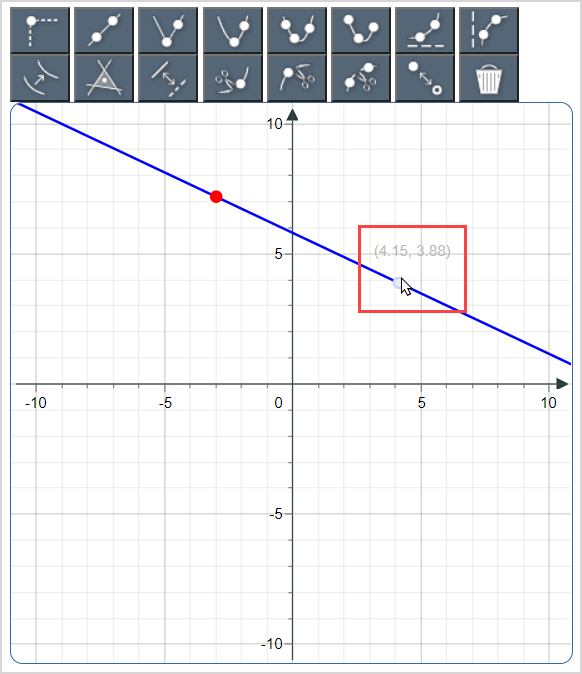
- Click-and-drag a plotted point or curve to reposition it on the Sketch Board.
Tools on the Sketch Board toolbar
You can perform a range of tasks using the sketching tools from the Sketch Board toolbar.

- Plot a single point
- Draw a line
- Draw an absolute value
- Draw a two-point parabola
- Draw a three-point parabola
- Draw a parabola segment
- Draw an exponential curve
- Draw a logarithmic curve
- Draw a background curve
- Draw a curve to be repositioned
- Select a region of a plot
- Make a line solid or dashed
- Remove a portion of a curve
- Remove a portion of a curve between two points
- Include or exclude an endpoint
- Delete a plotted element
Plot a single point
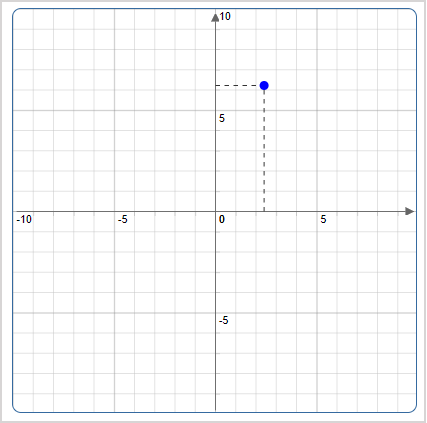
To plot a single point:
Click Plot Dropline Point
 .
.
Click on the Sketch Board plotting area where you want your single point plotted.
Draw a line
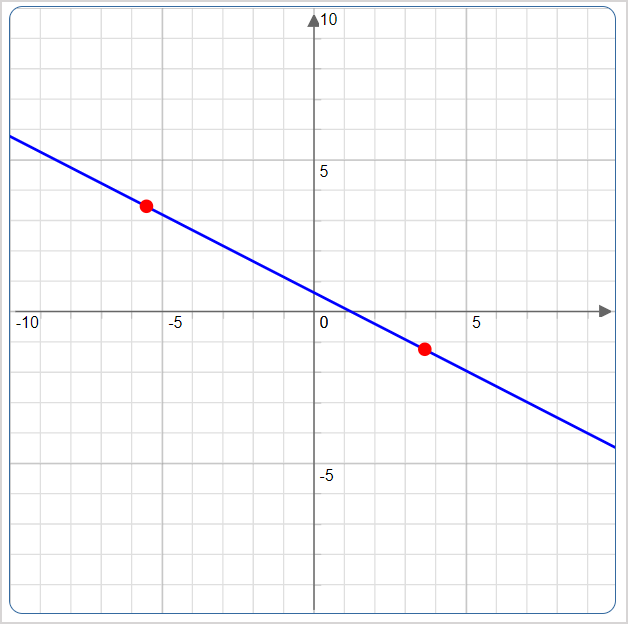
To draw a line:
Click Draw Line
 .
.
Plot two points on the Sketch Board plotting area. A line is automatically drawn through the points.
Draw an absolute value
To draw a vertex and an additional point as an absolute value:
Click Draw Absolute Value
 .
.
Plot the vertex on the Sketch Board plotting area.
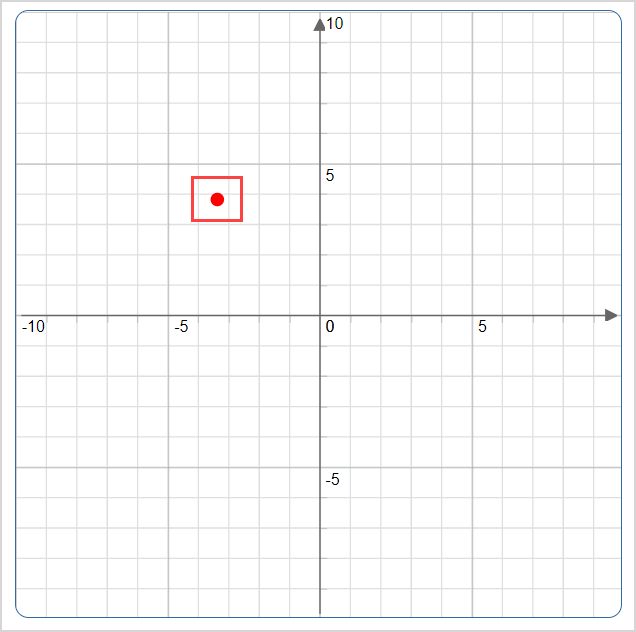
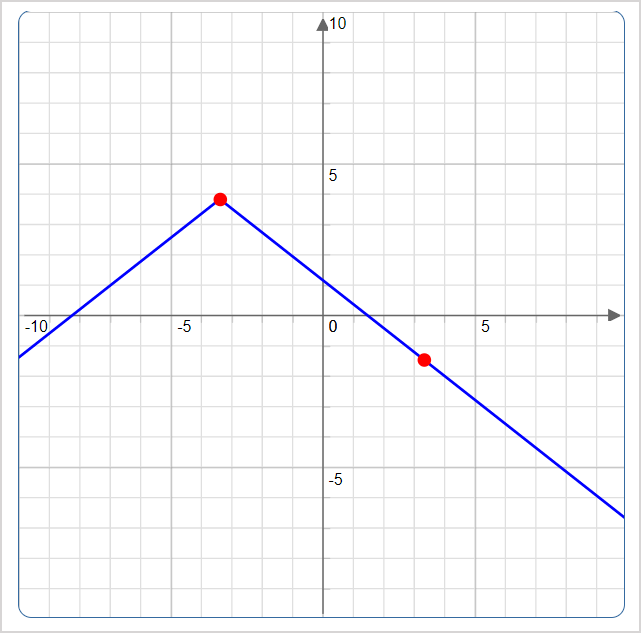
Plot the second point on the Sketch Board plotting area. The absolute value curve is automatically drawn through the points.
Draw a two-point parabola
To draw a two-point parabola:
Click Draw Vertex-Point Parabola
 .
.
Plot the vertex on the Sketch Board plotting area.

Plot your second point on the Sketch Board plotting area. The curve is automatically drawn through the points.

Draw a three-point parabola
To draw a three-point parabola:
Click Draw Three-Point Parabola
 .
.
Plot the three points in any order on the Sketch Board plotting area. A curve is automatically drawn with the vertex at the middle point.

Draw a parabola segment
To draw a parabola segment:
Click Draw Three-Point Parabola Segment
 .
.
Plot the three points in any order on the Sketch Board plotting area. A curve is automatically drawn with the vertex at the middle point.

Draw an exponential curve
To draw two points and a horizontal asymptote as an exponential curve:
Click Draw Exponential
 .
.
Plot two points on the on the Sketch Board plotting area.
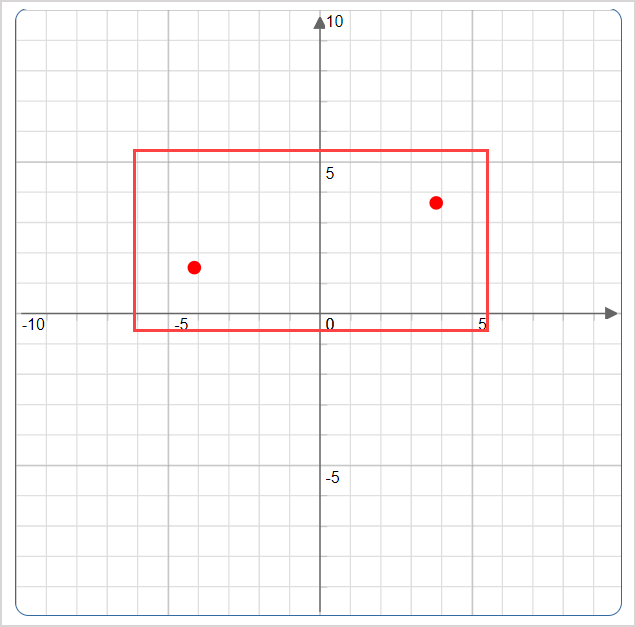
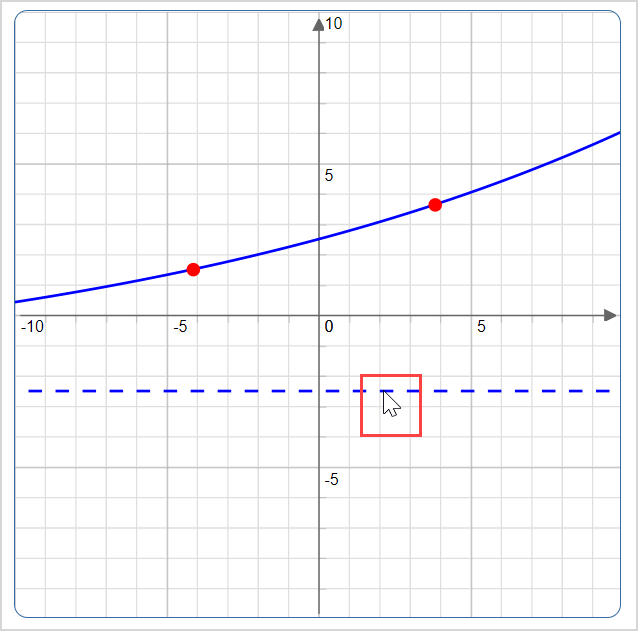
Click the location on the Sketch Board plotting area where you want to place the horizontal asymptote for the curve. A dashed horizontal line is automatically drawn through the point on the plotting area where you clicked.
Draw a logarithmic curve
To draw two points and a vertical asymptote as a logarithmic curve:
Click Draw Logarithmic
 .
.
Plot two points on the Sketch Board plotting area.
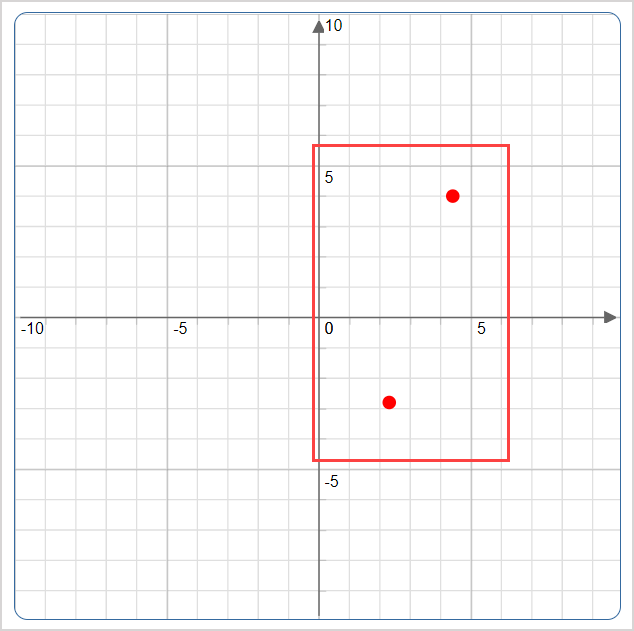
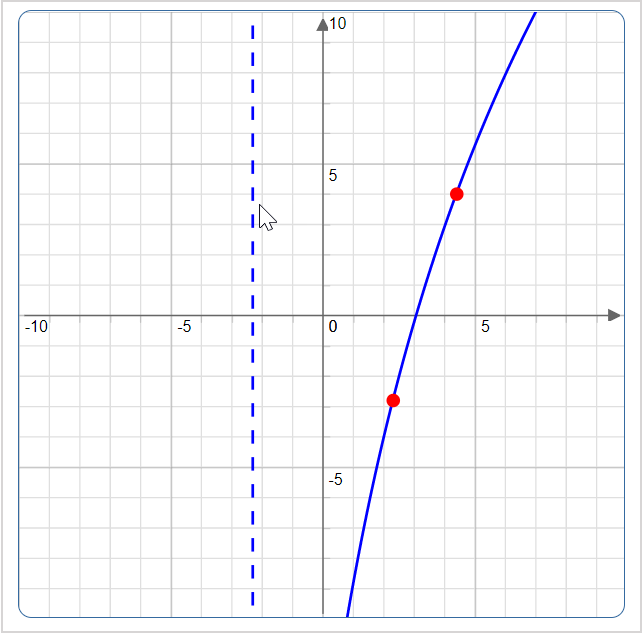
Click the location on the plotting area where you want to place the vertical asymptote. A dashed vertical line is automatically drawn through the point on the plotting area where you clicked.
Draw a background curve
To draw a read-only background curve that remains visible to students during their entire question attempt:
Draw a curve on the Sketch Board plotting area using the desired sketching tools.
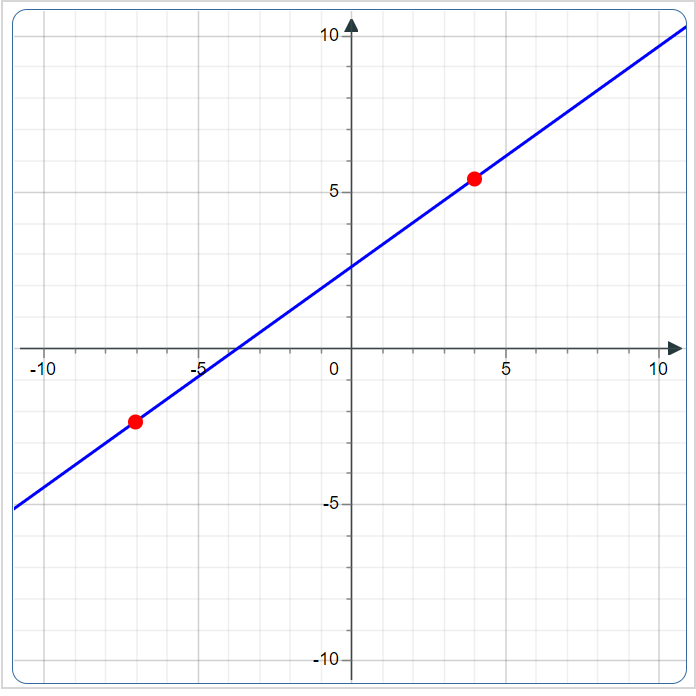
Click Switch Pre-Drawn
 .
.
NOTE: The Switch Pre-Drawn tool ![]() can also be used to draw a curve that requires repositioning on the plotting area during a student's attempt. Check out Draw a curve to be repositioned.
can also be used to draw a curve that requires repositioning on the plotting area during a student's attempt. Check out Draw a curve to be repositioned.
Click on the curve that you drew in step 1. This curve becomes thin and a read-only background curve that will appear visible on the student's Sketch Board plotting area during their attempt that can't be interacted with.
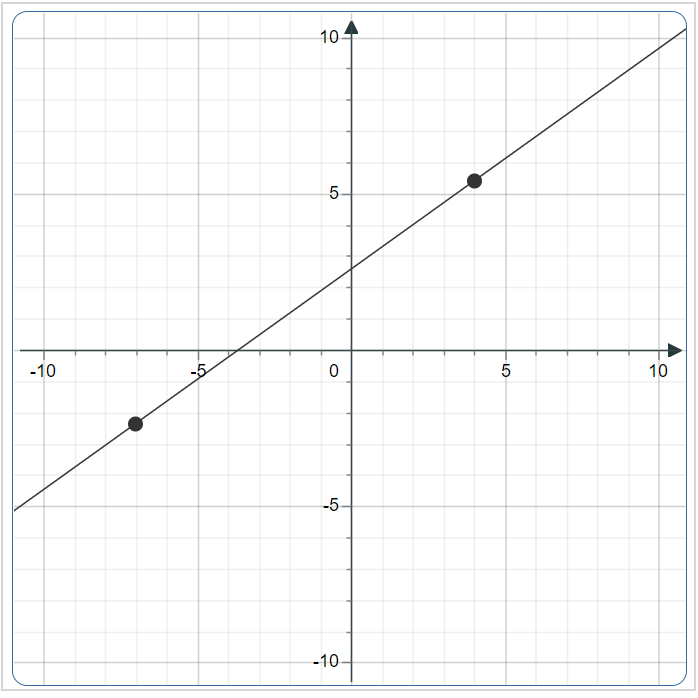
NOTE: A background curve will appear to students as a thin gray curve.
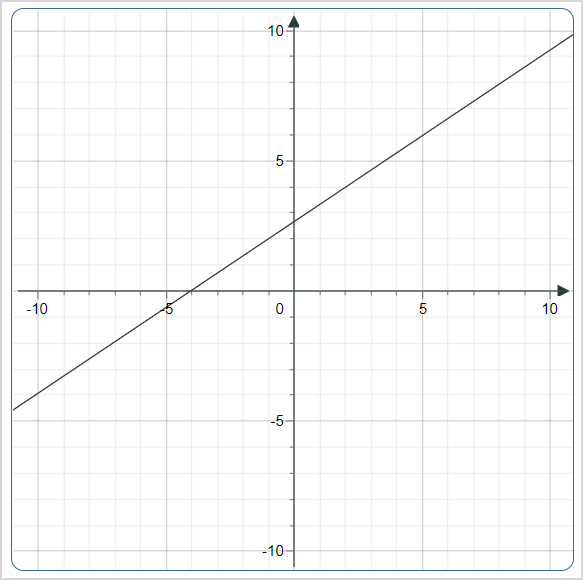
TIP: Want a little more freedom to customize your background function? Check out step 8 of the Author a sketching question help topic to see how you can use JavaScript syntax to customize the appearance of your background function.
Draw a curve to be repositioned
To draw a curve that students can reposition on the plotting area:
Draw a curve on the Sketch Board plotting area using the desired sketching tools.

Click Switch Pre-Drawn
 .
.
NOTE: The Switch Pre-Drawn tool ![]() can also be used to draw a read-only background curve that is visible to students on the plotting area during their entire question attempt. Check out Draw a background curve.
can also be used to draw a read-only background curve that is visible to students on the plotting area during their entire question attempt. Check out Draw a background curve.
Click-and-drag the curve that you drew in step 1 to a new position on the plotting area.

The original curve is a thin gray curve while the repositioned curve is a blue curve. Students must click-and-drag the original gray curve to the position of the repositioned blue curve to get the question correct.

NOTE: A curve to be repositioned will appear to students as a blue curve.

Select a region of a plot
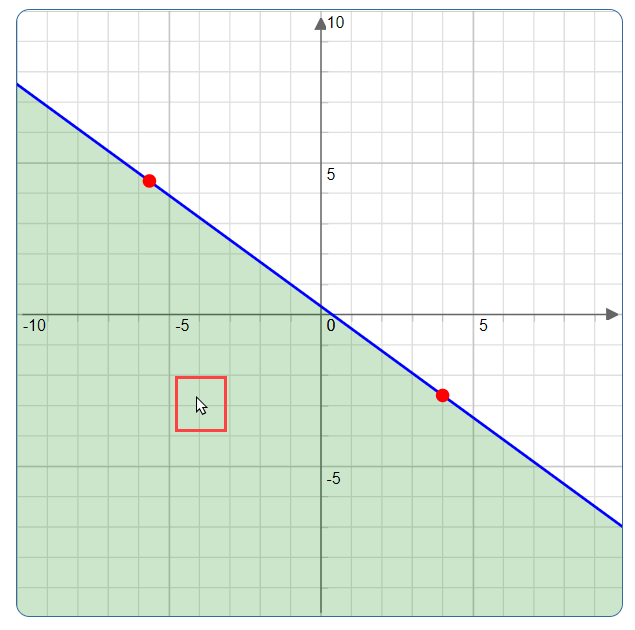
The Choose Region tool  allows you to select a region on either side of a single straight line or select a region bounded by two straight lines to indicate the correct answer.
To select a region of a plot:
Draw a straight line on the Sketch Board plotting area using the desired sketching tools.
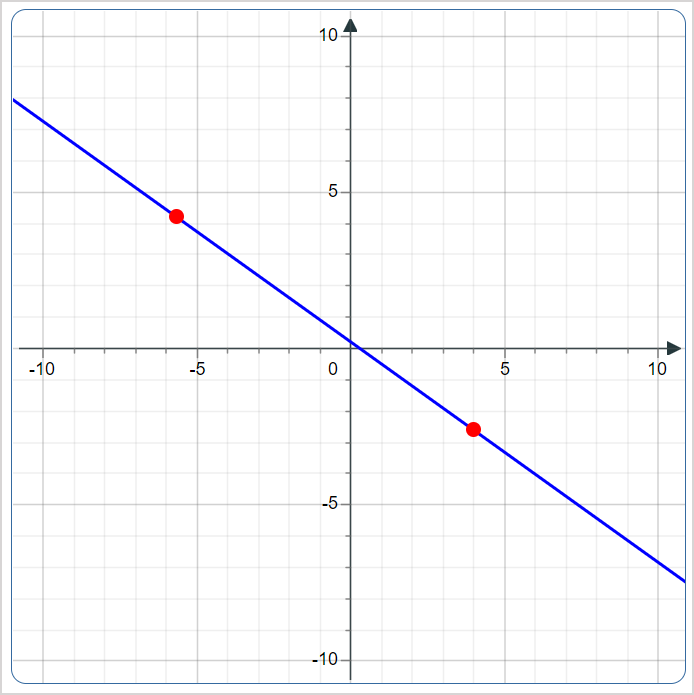
Click Choose Region
 .
.
Click anywhere on the plotting area inside the region that represents the solution set to the problem. The region becomes shaded and indicates the correct answer.
Make a line solid or dashed
To toggle between making a straight line solid or dashed:
Click Toggle Solid/Dashed
 .
.
Click on a drawn straight line. If the line was solid, then the entire line becomes dashed.

TIP: To change the straight line back to solid, click the line again (with the Toggle Solid/Dashed tool ![]() still selected) and it will revert back to its original state.
still selected) and it will revert back to its original state.
Remove a portion of a curve
To remove a portion to the left or right of a curve:
Click Snip Left
 or Snip Right
 .
.
Click on the portion of the drawn curve you want to keep. The portion to the left or right of your cursor (depending on the selected control) is removed.
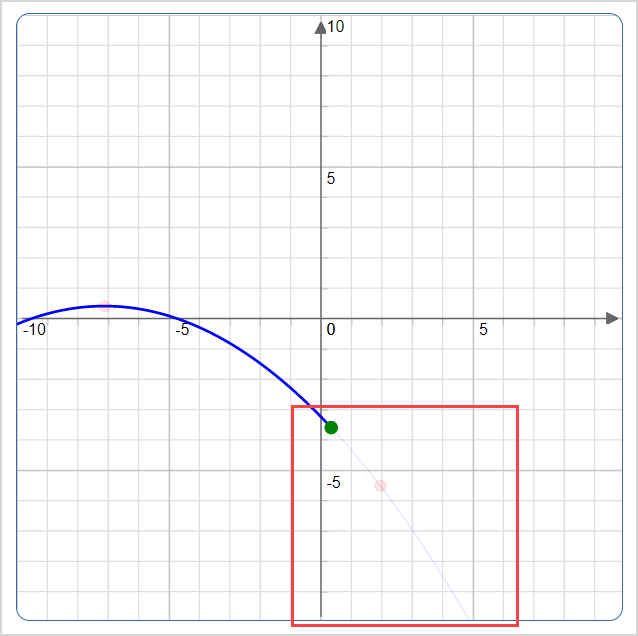
NOTE: If you selected Snip Left tool ![]() , the portion of the curve to the left of your cursor is removed. Similarly, if you selected Snip Right tool
, the portion of the curve to the left of your cursor is removed. Similarly, if you selected Snip Right tool ![]() , the portion of the curve to the right of your cursor is removed.
, the portion of the curve to the right of your cursor is removed.
NOTE: These snipping tools can only be used on a straight line or a two-point parabola.
Remove a portion of a curve between two points
To remove a portion of a curve between two selected points:
Click Snip Between
 .
.
Select two points on the drawn curve by clicking on them. A green point indicates each selected location. The portion of the curve between these two green points is automatically removed.
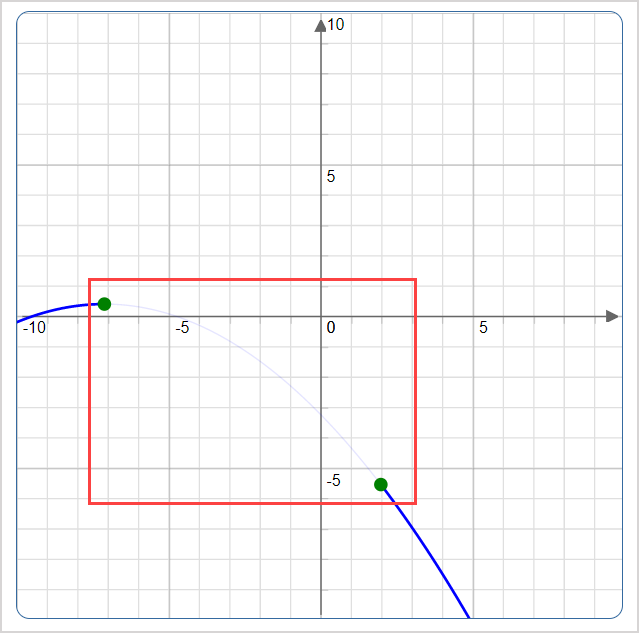
NOTE: The Snip Between tool ![]() generates two curves that are treated as two separate mathematical relations by default. Select Yes from the Group plots drop-down list before drawing your initial curve to treat the two new curves as belonging to one relation (Example — a piecewise function). Check out Author a sketch question for details on the Group plots option.
generates two curves that are treated as two separate mathematical relations by default. Select Yes from the Group plots drop-down list before drawing your initial curve to treat the two new curves as belonging to one relation (Example — a piecewise function). Check out Author a sketch question for details on the Group plots option.
NOTE: This snipping tool can only be used on a straight line or a two-point parabola.
Include or exclude an endpoint
To toggle between including (filled) and excluding (open) an endpoint:
Click Toggle Filled/Hollow
 .
.
Click on the endpoint that you want to include (fill) or exclude (open).

TIP: If the endpoint is filled (included), click on it (with the Toggle Filled/Hollow tool ![]() still selected) to make it open (excluded). Similarly, if the endpoint is open (excluded), click on it (with the Toggle Filled/Hollow tool
still selected) to make it open (excluded). Similarly, if the endpoint is open (excluded), click on it (with the Toggle Filled/Hollow tool ![]() still selected) to make it filled (included).
still selected) to make it filled (included).
Delete a plotted element
To delete a plotted element (Example — line, curve, point, etc.) from the Sketch Board plotting area:
Click Delete
 .
.
Hover your cursor over the element that you want to delete. The element becomes highlighted.
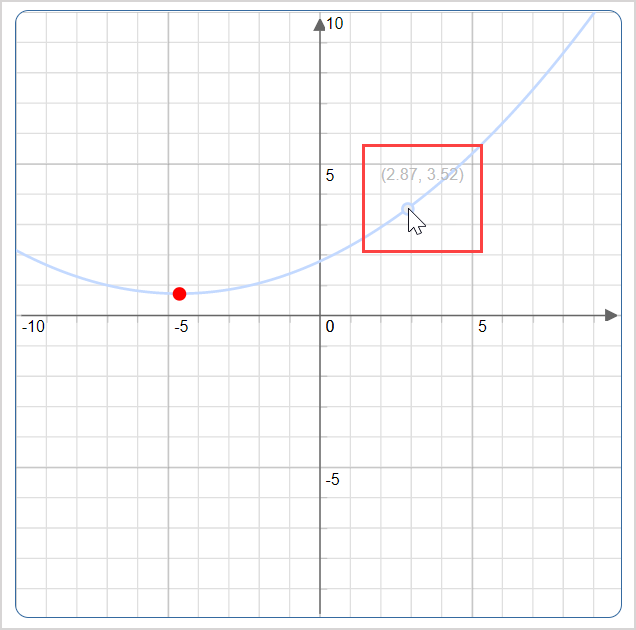
Click the highlighted element and it will be deleted from your Sketch Board plotting area.
IMPORTANT: Deleting an element from the Sketch Board plotting area can't be undone.