DigitalEd’s very own Data Scientist—Dr. Aron Pasieka—and I hung out one afternoon to discuss all of the amazing data insights that someone can get out of Möbius and Möbius Grading.

We put together this four-part blog series to explain how thanks to Möbius and Möbius Grading, you can go beyond interpreting just a single grade snapshot to really understand how your students and content are performing.
What’s more is that you don’t even need to be a data scientist to do it!
This PART II blog covers how you can create and experiment with Möbius Grade Reports to explore how your students are doing.
You might also want to check out:
-
- PART I: Evaluate the Performance of Your Questions (Möbius)
- PART III: Engagement Insights with Möbius Analytics (Möbius)
- PART IV: Data Even From Paper-Based Grading (Möbius Grading)
You can also learn more about the differences between Möbius and Möbius Grading with DigitalEd MythBusters: Möbius VS Möbius Grading.
Möbius Grade Reports for cumulative student data
What is it for? Providing comprehensive views of student overall performance.
Why do I need it? To give your students a view of their overall performance in your class and to help you appropriately and fairly allot the weights of the assessments offered throughout your course.
Grade Reports in Möbius show how your students are performing in your course across all assessments or across a subset of assessments.
For example, consider a scenario in which you want to see how your students have performed on all of the assessments from the first half of your course so that you can compare student performance pre- and post-midterm.
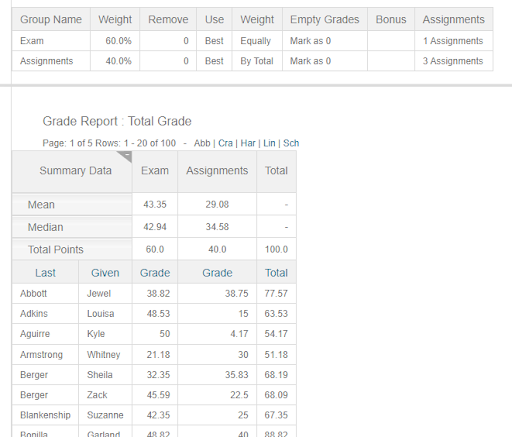
You can create a Möbius Grade Report that allots the weights of the three pre-midterm assignments as 40%, and the midterm exam as the remaining 60%:

Möbius will then calculate students’ overall grades as a Total Grade using the weightings you defined for the subset of assessments that make up the Grade Report. This then gives you and your students (your students can view these from their Möbius Gradebooks!) an accurate view of their overall performance across selected assessments in your course.
These reports can also be used to investigate how a student’s overall grade is affected based on assigning different weights to specific Möbius assessments. For example, you could explore what would happen if you modified the midterm weighting to be 70 % instead of 60% (and therefore the assignments would be worth 30% instead of 40%).
You can create multiple Grade Reports that will supply different grades for different parts of your course, or use one comprehensive report for all assessments in your course.
You can even designate certain assessments as bonuses, and drop or ignore others.
With Möbius, you can get back to teaching the way you want to teach by having full control over your curriculum, giving both you and your students peace of mind!
Connect with us to see how you can dig deeper into student performance using Möbius!
Now you’re ready for:
-
- PART III: Engagement Insights with Möbius Analytics (Möbius)
- PART IV: Data Even From Paper-Based Grading (Möbius Grading)
Or, go back and check out:

