Author a sketch question
A sketch question involves students using sketching tools from the Sketch Board toolbar to plot a curve on a Sketch Board.
IMPORTANT: Screen readers can't interpret sketching questions.
IMPORTANT: Sketching questions don't support algorithms.
You can define a single curve or a group of curves as the correct answer, as well as customize the display of the Sketch Board's plotting area.
The tools that are available to your students while attempting your sketch question can be customized (check out Customize the student Sketch Board toolbar).
Some example sketch questions that you could ask are:
- Graph a single or multiple lines or curves.
- Indicate which region represents the solution set (single line or curve, multiple lines or curves).
- Make the line solid or dashed to indicate whether the line is in the solution set.
- Remove the portion of the line or curve that does not belong.
- Use an open or closed circle to indicate whether the endpoints belong.
- Add asymptotes to logarithmic and exponential curves.
- Demonstrate what will happen in the supply/demand graph if the supply decreases by 3 at each price.
TIP: Check out View additional examples of sketch questions to inspire your sketch question authoring creativity.
TIP: All questions are authored using the Question Editor. Check out Author a question to learn how to access the Question Editor.
To author a sketch question
To author a sketch question from the Question Editor:
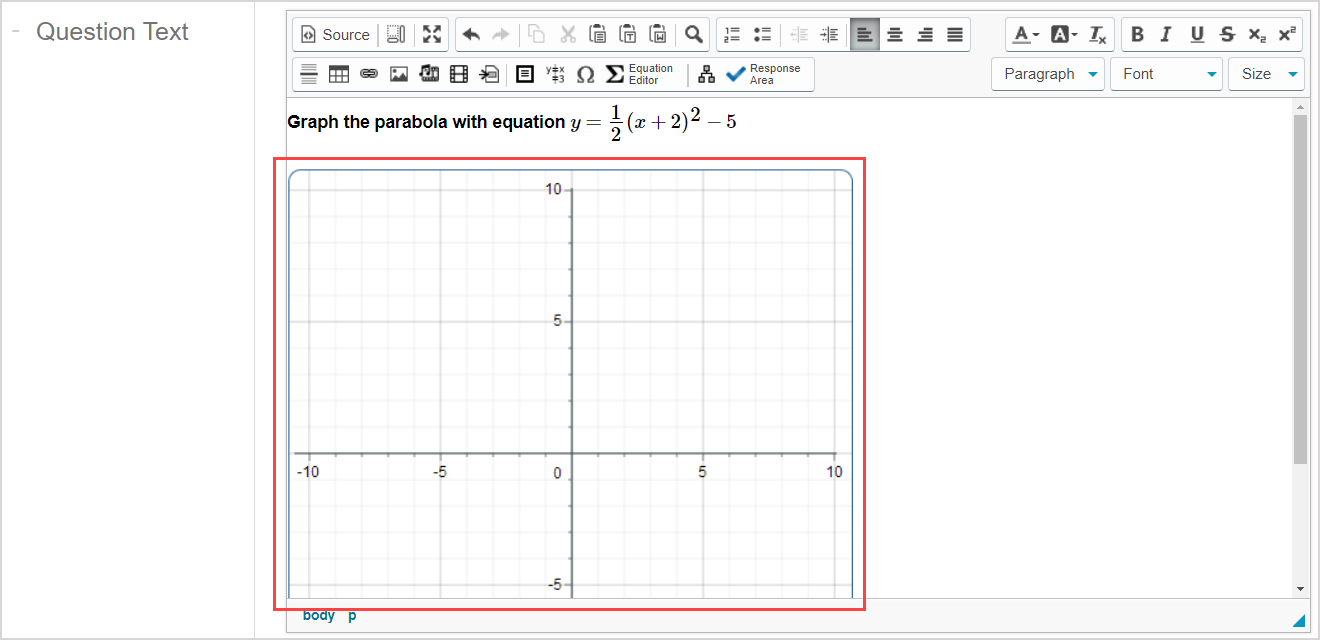
Enter the question statement in the Question Text pane of the Question Editor.
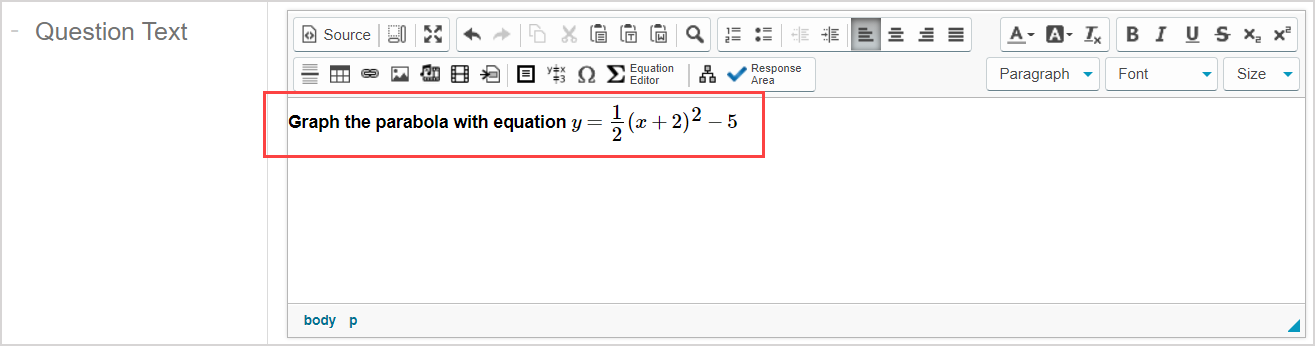
TIP: Check out Use the Visual Editor for details on how to use this toolbar to the fullest to control the visual appearance of your sketching question text.
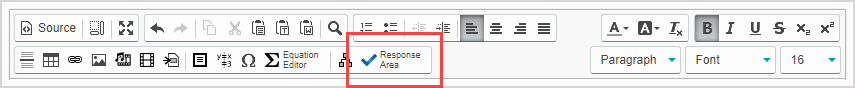
Click Response Area
 to select the type of response area for this part of the question.
NOTE: A question can have multiple question parts. Each question part have a different type of response area. Example — A question could have the first response area as a sketch response area, and a second response area as clickable image.
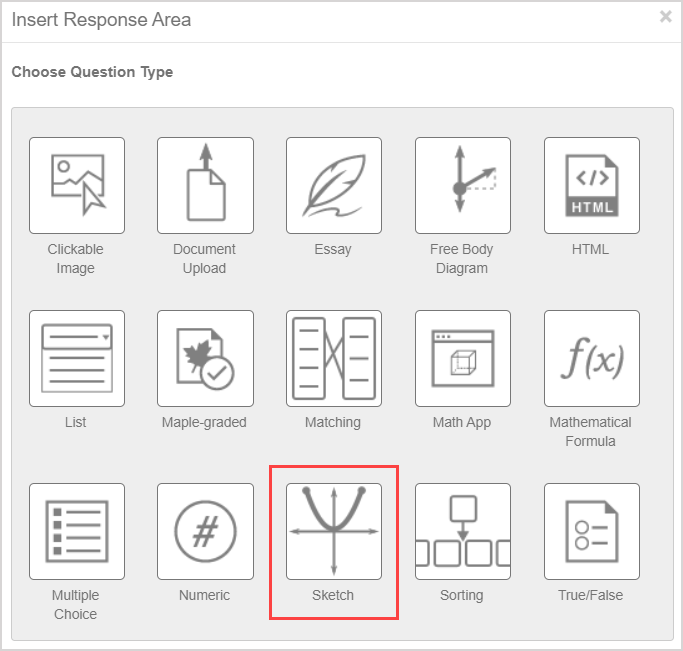
Click Sketch from the list of response area types.
Assign a weight to the response area. The default response area weighting is 1.
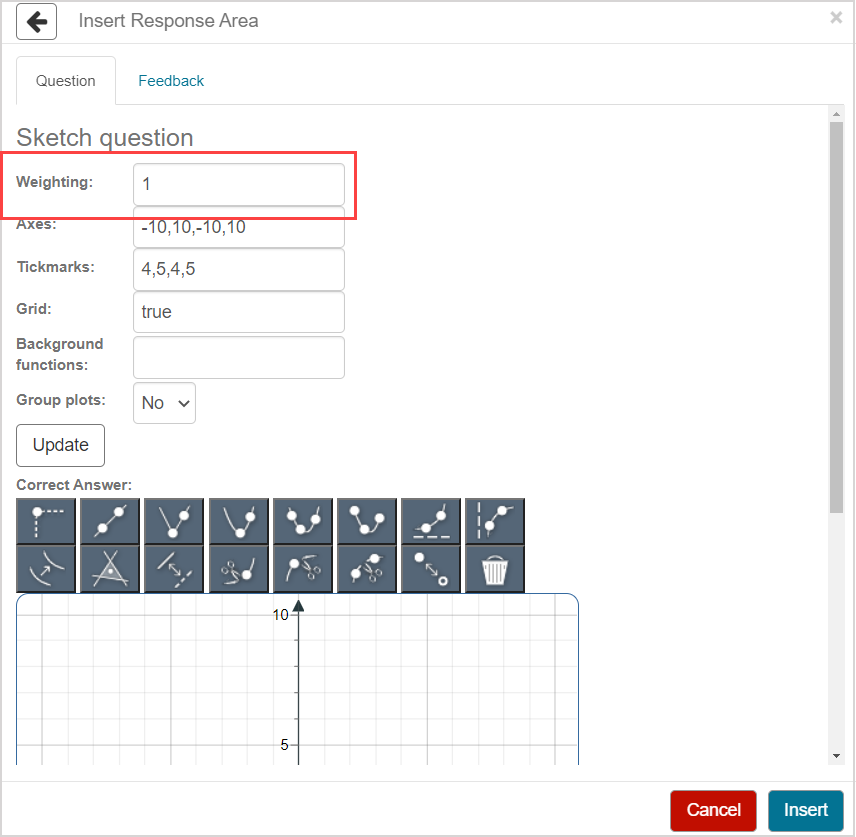
TIP: The response area weight can be any integer greater than 0. Response area weighting is proportionate to the question total. Example — A question with two response areas could have the first response area weighted as 2, and the second response area weighted as 4. This means that the second response area will be worth twice as much as the first response area when calculating the total grade for the question.
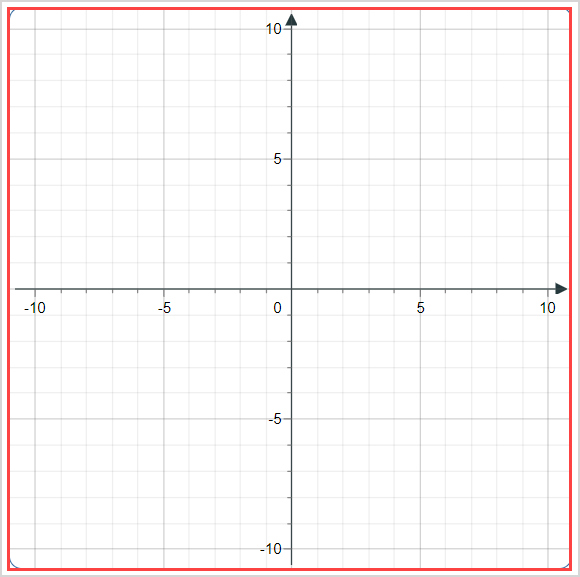
Define the ranges that you want to be visible for the x-axis and y-axis using the Axes field. Enter numerical values for the axes using the following form: x-axis minimum value, x-axis maximum value, y-axis minimum value, y-axis maximum value. Example — The default axes values are -10,10,-10,10.
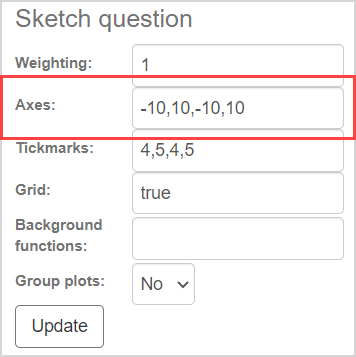
NOTE: The Axes field determines the range of the Sketch Board plotting area:
The physical dimensions of the Sketch Board plotting area can't be changed.
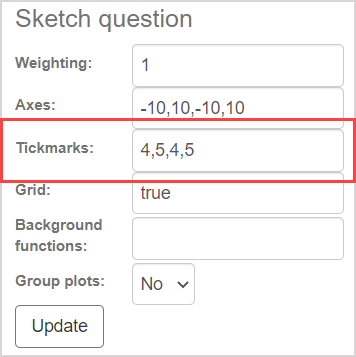
Define the tickmarks that you want to be visible for the x-axis and y-axis using the Tickmarks field. Enter numerical values for the tickmarks using the following form: x-axis major tickmarks, x-axis minor tickmarks, y-axis major tickmarks, y-axis minor tickmarks. Example — The default tickmark values are 4,5,4,5.
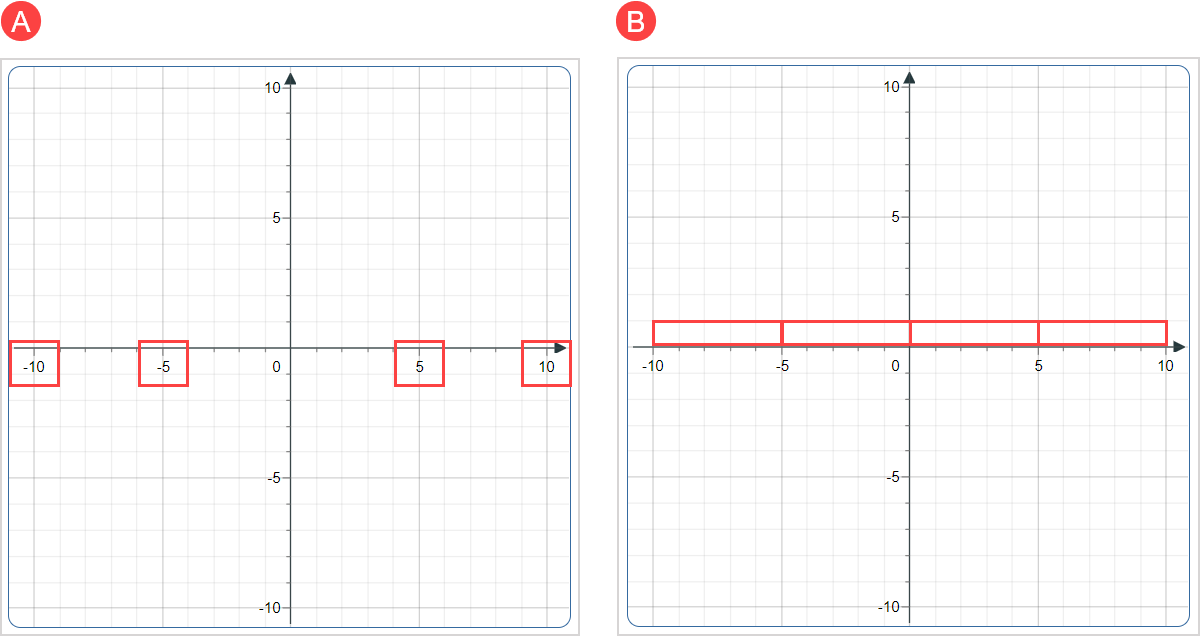
NOTE: The major tickmark values determine where the numerical axis labels are placed based on the axes ranges defined at step 5. Example — (A) Using the default defined tickmarks of (4,5,4,5), four numerical x-axis labels are placed at equally-spaced positions along the x-axis based on the default x-axis range of -10 to 10. (B) This creates four regions on the Sketch Board.
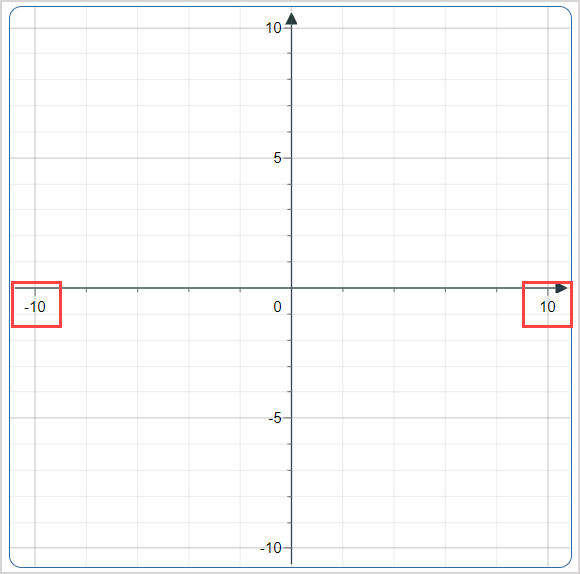
Changing the tickmark values to (2,5,4,5) creates two numerical x-axis labels that are placed at equally-spaced positions along the x-axis based on the default x-axis range of -10 to 10.
The same principles apply to the y-axis major tickmarks.
NOTE: The origin (0,0) is automatically treated as a major tickmark and is always visible.
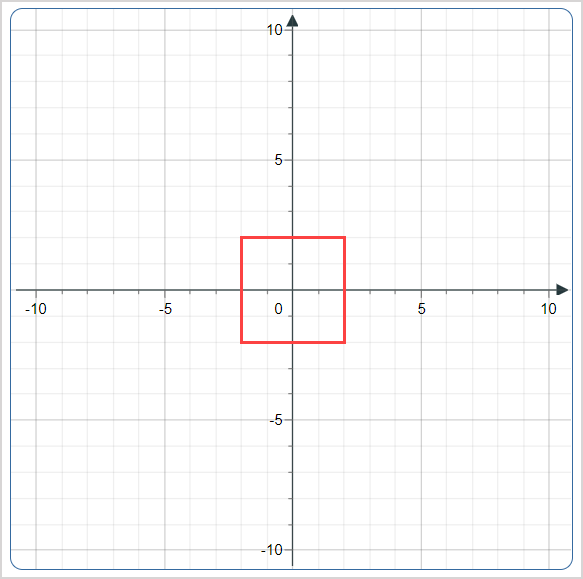
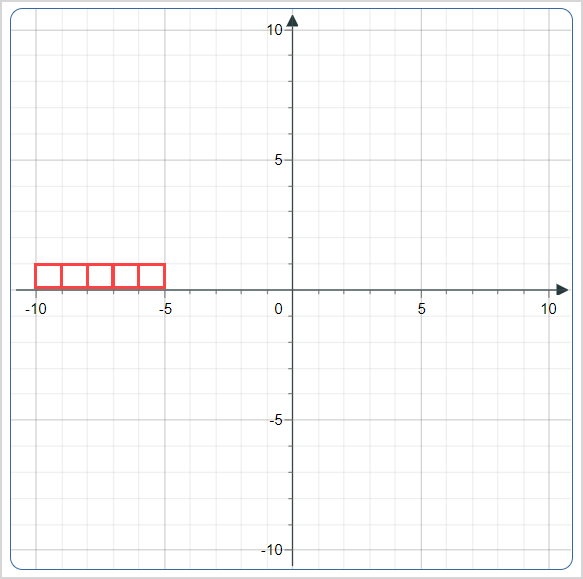
NOTE: The minor tickmark values determine how many regions are visible as unlabeled markings between the labeled major tickmarks. Example — Using the default defined tickmarks of (4,5,4,5), five regions indicated by unlabeled markings are found between the major tickmarks on the x-axis.
Changing the tickmark values to (4,2,4,5) creates two regions with unlabeled markings between the major tickmarks on the x-axis.
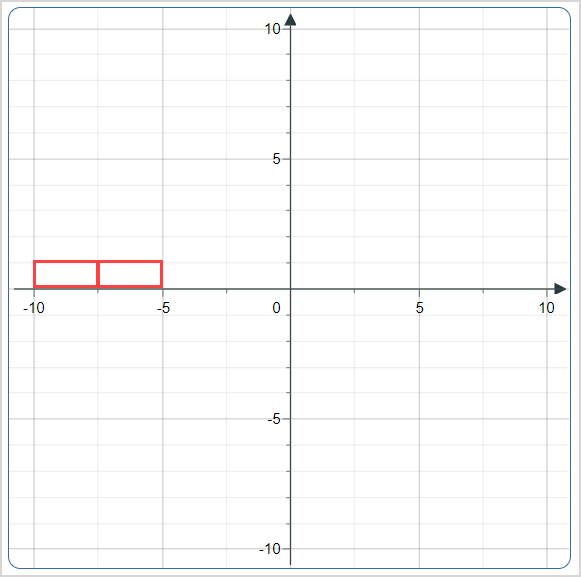
The same principles apply to the y-axis minor tickmarks.
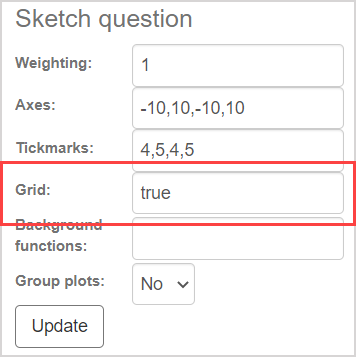
Define if the gridlines are visible on your Sketch Board by manually entering one of the following values in the Grid field:
- true — Gridlines are visible (entered by default)
- false — Gridlines are hidden
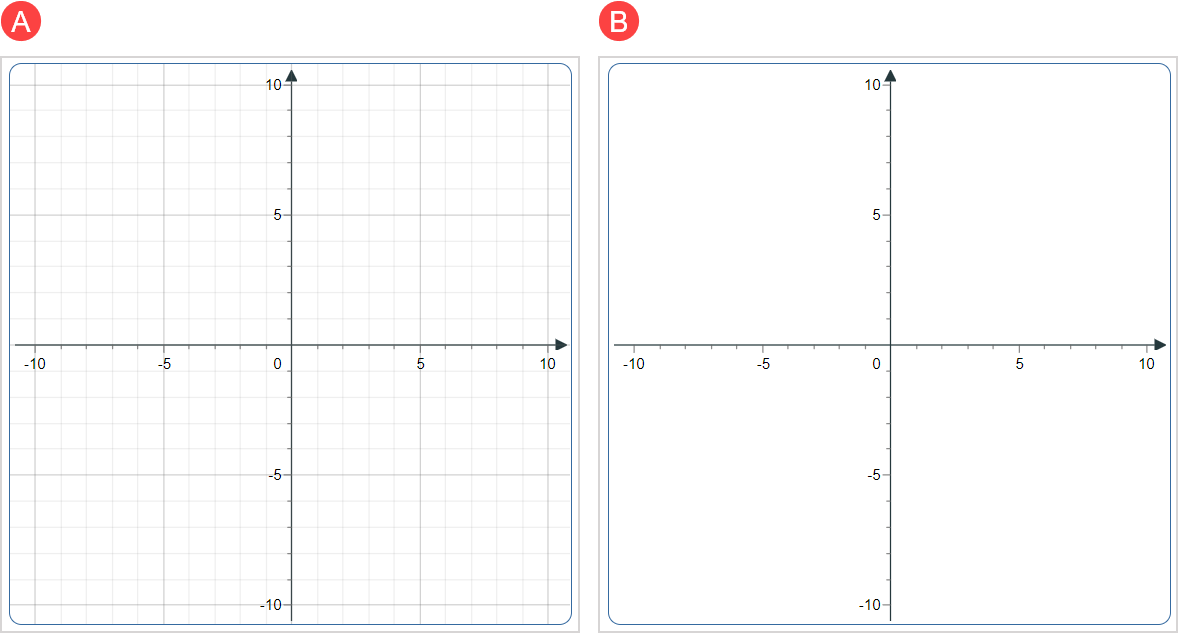
NOTE: (A) Gridlines are drawn through all tickmarks defined in step 5 when the Grid field is set to true. (B) No gridlines are drawn when the Grid field is set to false.
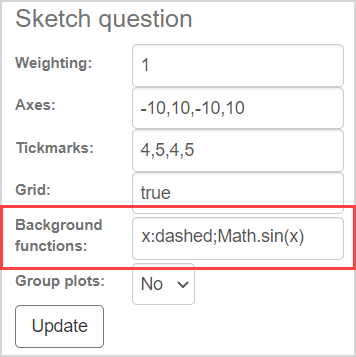
(Optional) You can pre-populate the Sketch Board plotting area with highly customizable curves drawn in the background by entering functions in the Background functions field (Example — Math.pow(4,x);).
NOTE: Background functions defined in this step:
- Are for display purposes only and aren't used for grading
- Must be entered as a semicolon-separated (;) list
- Must be in JavaScript syntax
TIP: Want to use a background function but aren't a JavaScript expert? No problem! Check out the Draw a background curve subsection of the Use the Sketch Board toolbar help topic. You'll see how to draw a background function without needing to use JavaScript syntax using the Switch Pre-Drawn  sketching tool. This toolbar method also allows you to click-and-drag your background function to relocate it if needed.
TIP: Example — To show the sine curve and the main diagonal (as dashed), then enter the following functions in the Background functions field:
x:dashed; Math.sin(x)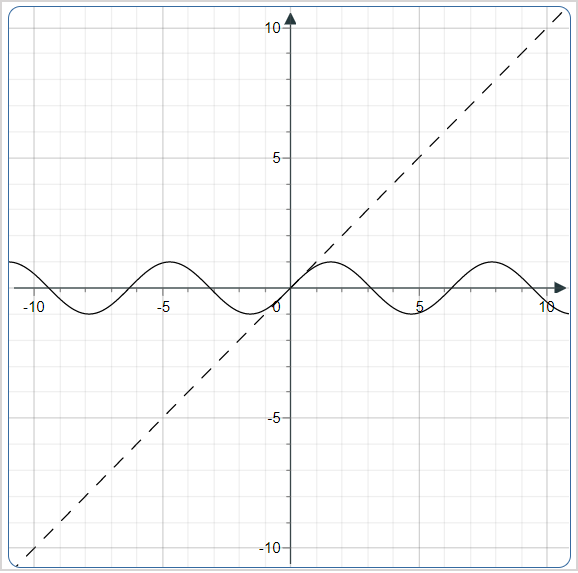
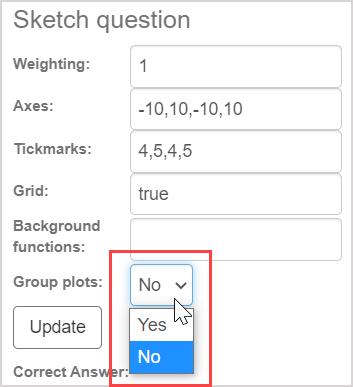
(Optional) You can graph more than one curve on the Sketch Board. Use the Group plots drop-down list when plotting multiple curves to select:
- Yes — All of the curves you're about to plot are to be grouped as one mathematical relation and all curves are the same color (Example — a piecewise function)
- No — All of the curves you're about to plot exist as separate functions, and each curve is a random color (selected by default)
IMPORTANT: Axes, tickmarks, grid, and optional background function settings can be changed at anytime during your question authoring. However, the Group plots field must be defined before plotting your curves on the Sketch Board.
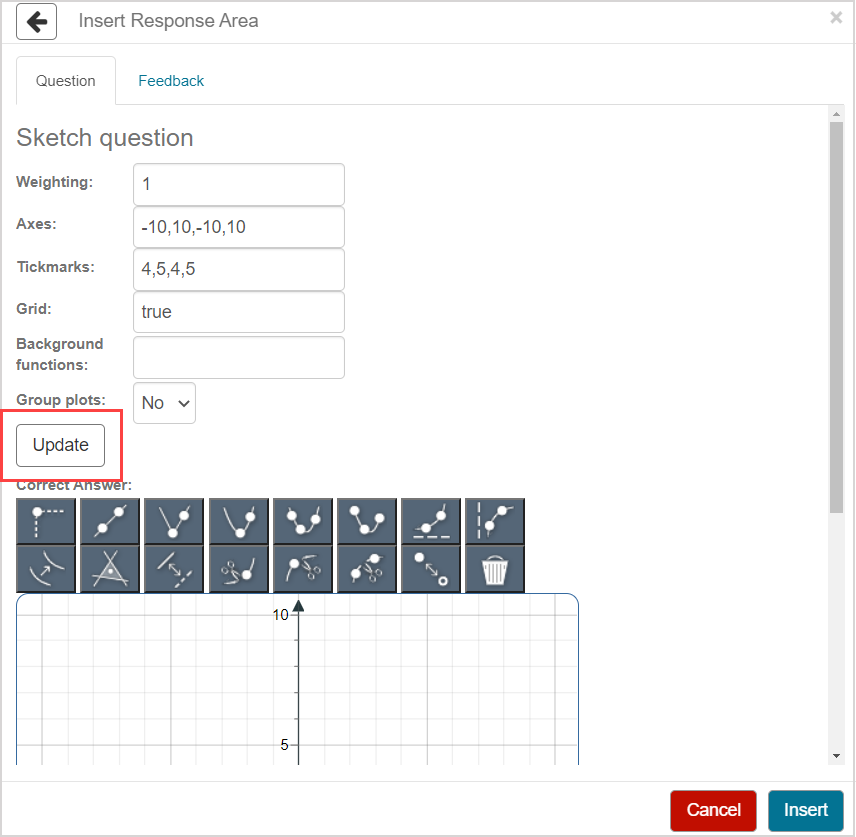
Click Update so that your Sketch Board is configured to accept your grouped plots (if Yes is selected at step 9) and shows your defined axes, tickmarks, grid, and optional background function settings.
TIP: Click Update every time you make a change to the Sketch Board's settings of:
- Axes
- Tickmarks
- Grid
- Background functions
- Group plots
Plot your correct answer on the Sketch Board using the Sketch Board toolbar.
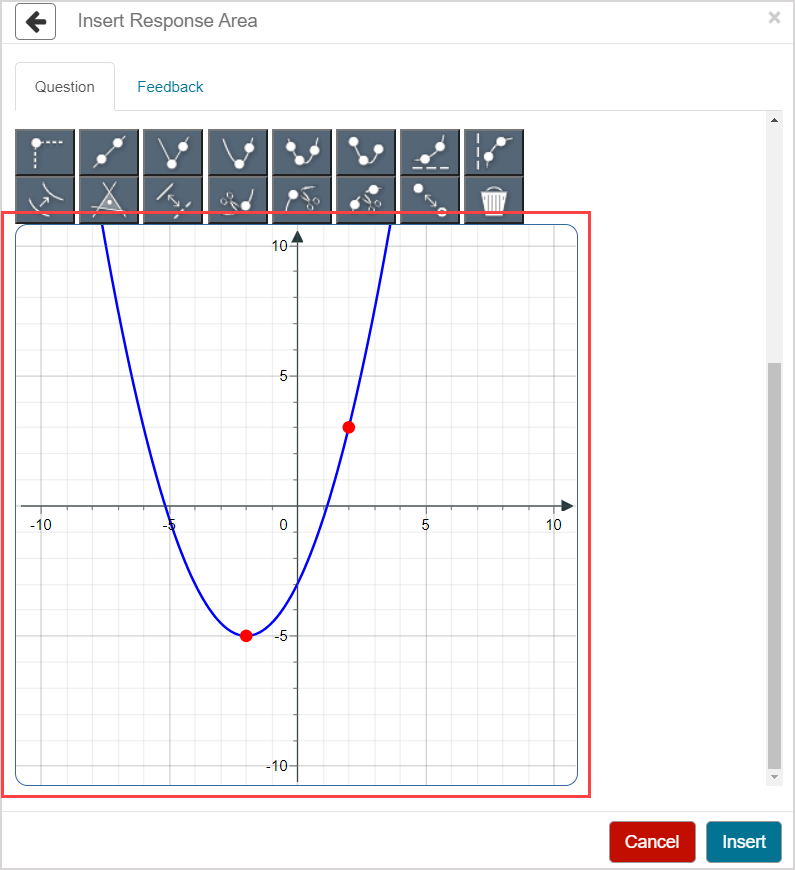
TIP: Check out Use the Sketch Board toolbar for details on how to use each available curve sketching tool.
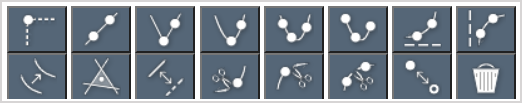
TIP: The sketching tools that you use to plot the correct answer are the sketching tools that are available to your students on their Sketch Board toolbar while attempting your sketch question. You can customize what sketching tools are available to your students. Check out Customize the student Sketch Board toolbar.
Click Insert to add this response area to the question.

The response area is inserted into your question (indicated with an empty plotting area placeholder).
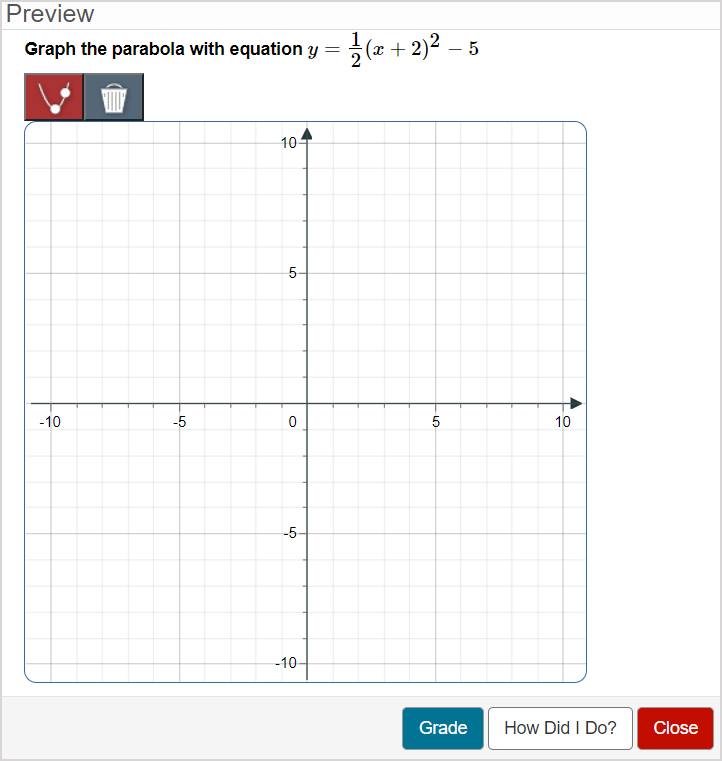
Click Preview to trial your new question to ensure that it behaves as expected.

TIP: You first have to click the save icon if you're creating this question from within an Activity Editor. After the question has been saved, you can then click the preview icon
 to ensure that your new question behaves as expected.
Click Save to save your new question. Your new question is now stored in the Questions pane of the Content Repository.

TIP: Click the save iconif you're creating this question from within an Activity Editor. This saves your question to the activity and the Content Repository.
Grading details for sketch questions
Sketch questions are graded as correct or incorrect with no partial grading when only one curve is being assessed.
Partial grading is awarded when multiple curves are being assessed.
NOTE: The Group plots option must be set to No for partial grading to be awarded when assessing multiple curves.
NOTE: When multiple curves are being assessed, marks aren't deducted for curves in the student's response don't match anything in the correct answer:
Example — Consider a correct answer consists of a line and a parabola and the student is permitted to only draw two curves:
- If student draws two curves and one of them matches the correct answer, they'll receive 50% for the question and there's no deduction applied to the incorrectly drawn curve.
Example — Consider a correct answer consisting of a line and a parabola but the student is permitted to draw more than two curves (check out Customize the student Sketch Board toolbar to see how to modify a sketching question to permit a student to draw additional curves):
- If student draws three curves, they'll receive 0% for the question because they drew three curves instead of the correct two.
Sketch questions have a built-in tolerance that is based on the curve being plotted to determine how close the student response has to be to your defined correct answer.
TIP: This plotting tolerance can be customized in the question's source code using the following grading code:
op(1,[Grading:-GradePlot($ANSWER, $RESPONSE, $PLOTVIEW, tolerance=n.n)]);The tolerance value of n.n can be any value between 0.0 and 1.0. The closer the tolerance value is to 0.0, the more accurate the student's response must be to be graded as correct.